Key takeaways
- Dogecoin is trading near $0.070 after declining 3.5% last week.
- DOGE’s long-to-short ratio rose to a one-month high of 1.25, signaling bullish positioning.
- Funding rates remain positive at 0.0074%, indicating stronger demand for long positions.
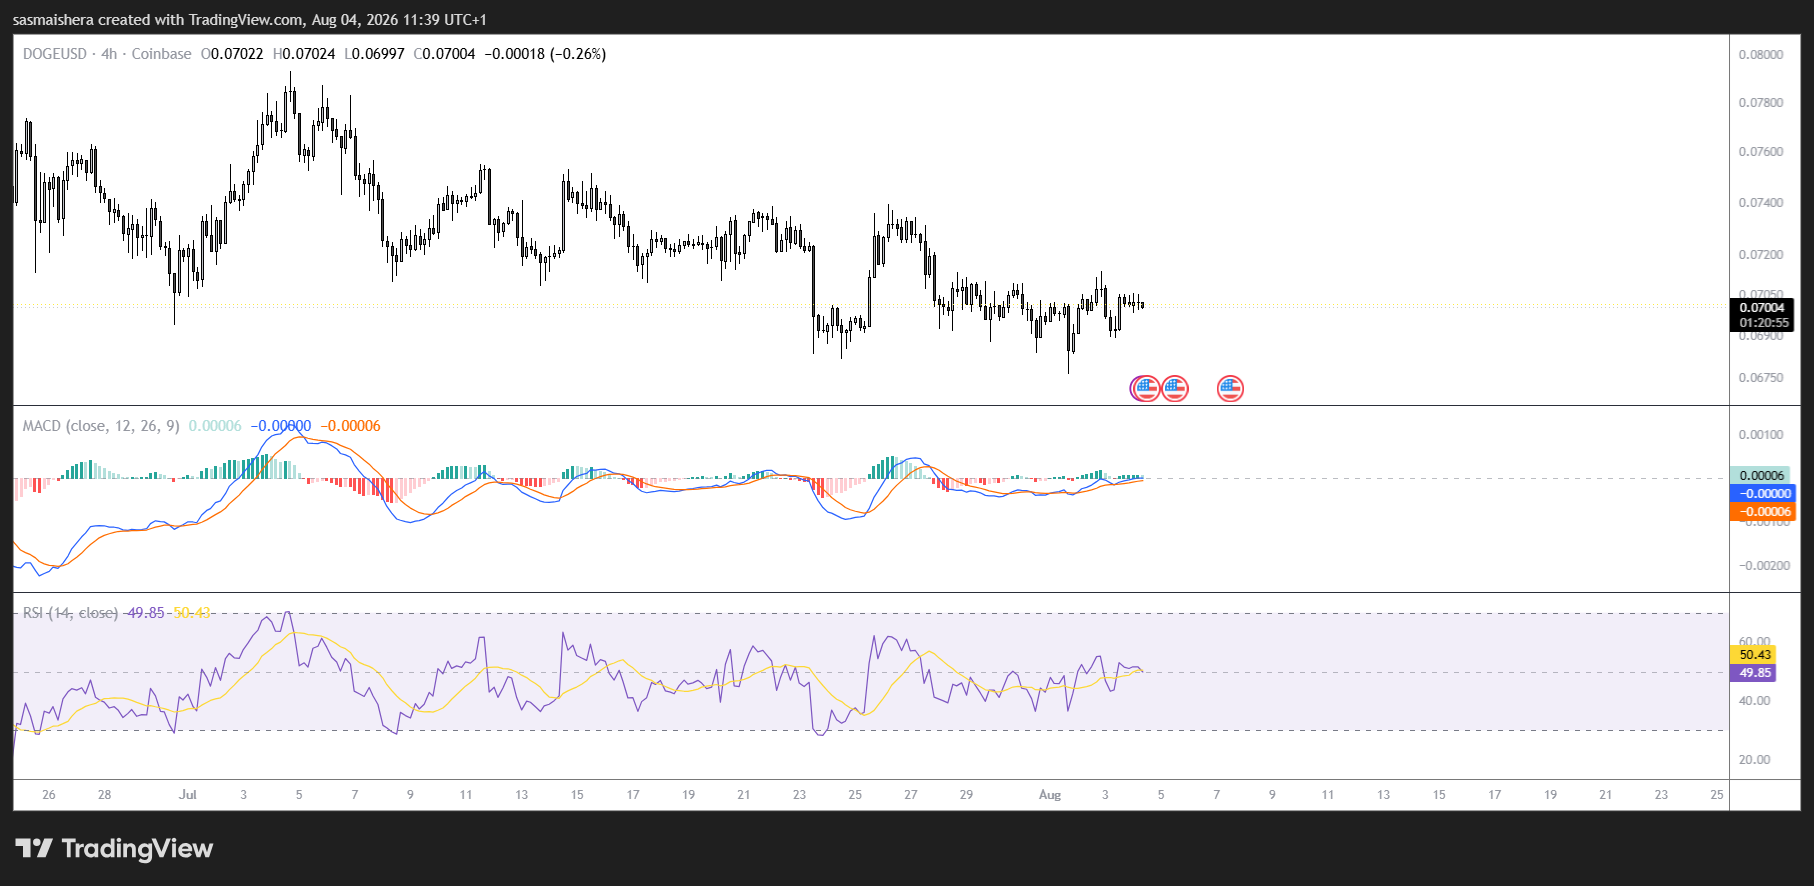
Dogecoin (DOGE) is holding steady near $0.070 at the time of writing on Tuesday after falling 3.5% last week.
Although the broader technical trend remains bearish, improving derivatives data and bullish divergences across key momentum indicators suggest that selling pressure may be easing. This setup could support a short-term recovery if buyers defend the current support zone.
Derivatives data supports a bullish DOGE outlook
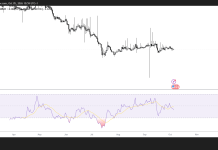
Dogecoin derivatives traders are showing signs of growing optimism. The DOGE long-to-short ratio climbed to 1.25 on Tuesday, its highest level in more than a month, according to CoinGlass.
A reading above 1 indicates that long positions outnumber shorts, suggesting more traders expect the price to rise.
Dogecoin’s funding rate also supports this bullish outlook. The rate turned positive on July 24 and stood at 0.0074% on Tuesday.
Positive funding rates mean traders holding long positions are paying those with short positions, typically reflecting stronger demand for bullish exposure.
Dogecoin technical outlook: Bullish divergence emerges
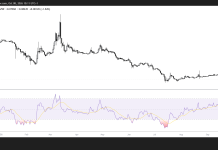
Dogecoin is trading near $0.070 on Tuesday but remains below its major moving averages, maintaining a bearish near-term structure.
The 50-day, 100-day, and 200-day Exponential Moving Averages are located at $0.075, $0.083, and $0.100, respectively. These levels are expected to act as resistance during any recovery attempt.
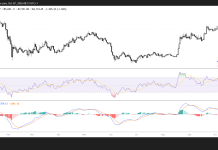
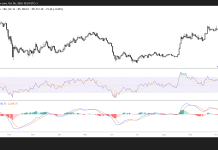
However, momentum indicators suggest bearish pressure is beginning to fade. DOGE formed a lower price low on August 1 while the daily Relative Strength Index registered a higher low. This bullish divergence indicates that selling momentum is weakening despite the decline in price.
The Awesome Oscillator reinforces this signal. Its recent lows have been rising while DOGE continues to trade near its price lows, suggesting that downside momentum is losing strength.
Immediate support is located at the horizontal level of $0.070. If DOGE loses this level, the yearly low at $0.067 would become the next key support. A decisive daily close below $0.067 could trigger further losses toward the psychological level of $0.065.
The 50-day EMA at $0.075 represents the first major resistance level. Above it, DOGE could encounter selling pressure around the descending trendline breakout area near $0.080, followed by the 100-day EMA at $0.083 and horizontal resistance at $0.088.
A stronger recovery would require Dogecoin to reclaim the 200-day EMA at $0.100 and the major horizontal barrier at $0.102. Moving above these levels would help ease the prevailing bearish outlook.
The post Dogecoin holds $0.070 as bullish divergence signals easing selling pressure appeared first on CoinJournal.